52%
Logistics
RESOURCE · GATED REPORT
A plain-words briefing on the service-robotics opportunity in Europe and the Gulf — demand by type, the density gap, and the 70% that decides every deployment.
IFR MARKET DATA
Top-3 sectors shown · Source: IFR World Robotics 2025.
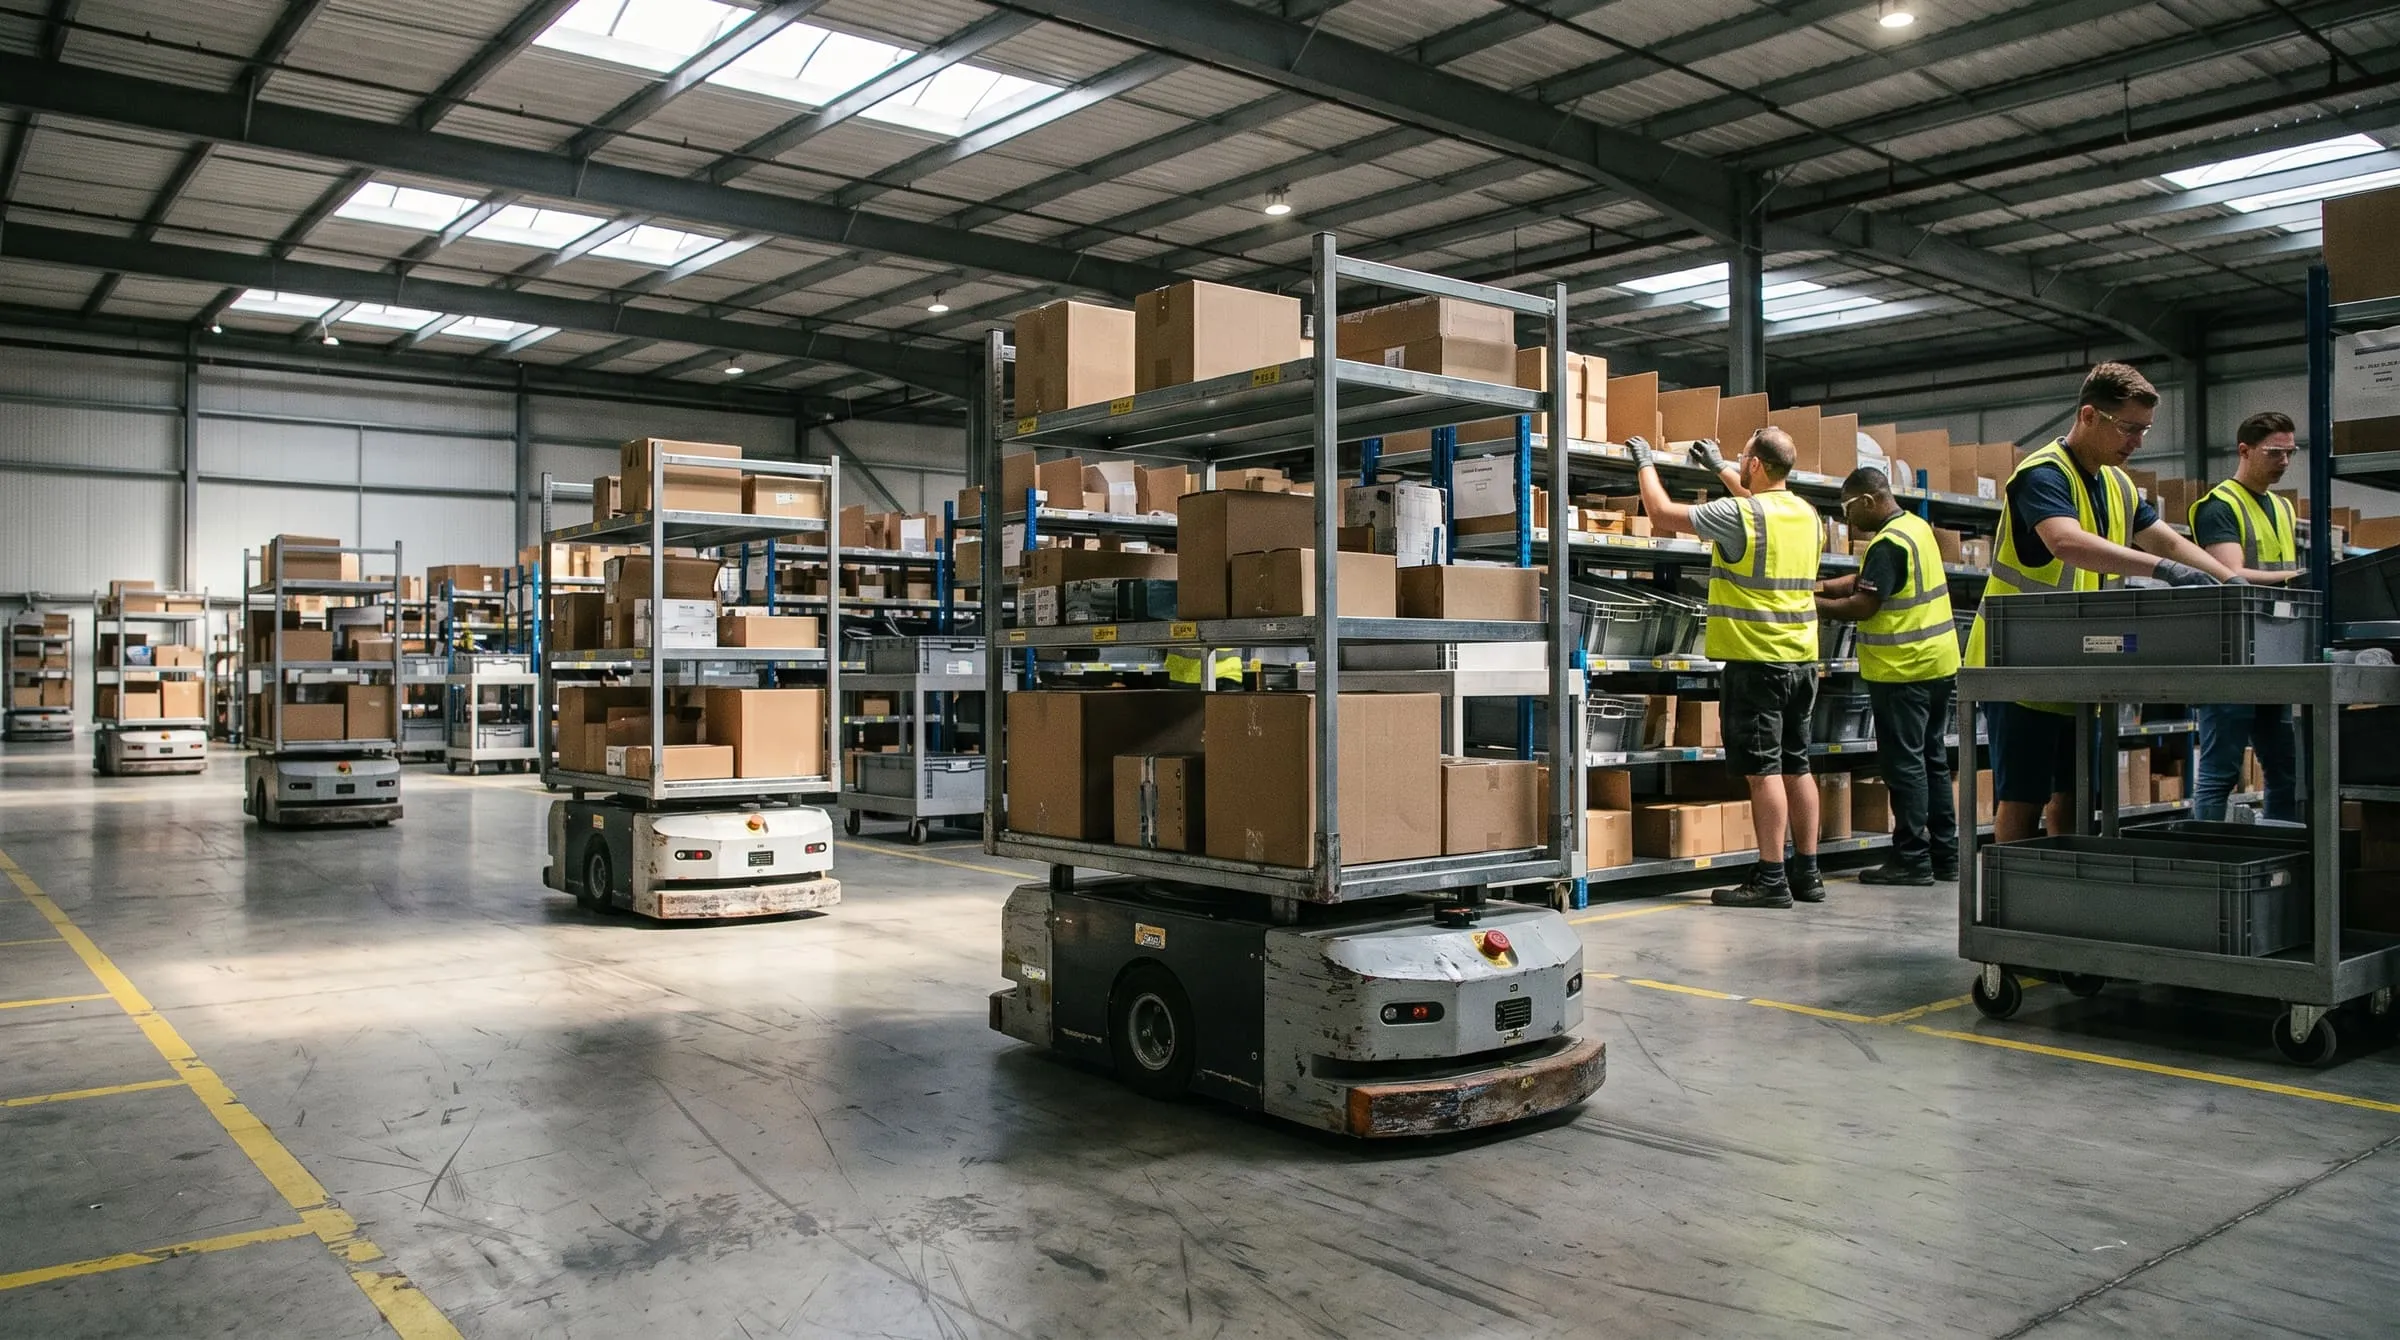
52%
Logistics
21%
Hospitality
13%
Cleaning
THE ROBOT MAP
Working machines by task — the map the alliance curates, chosen and never crowded.
01
Totes and pallets between stations, every shift.
Buys first and at scale — the volume category.
02
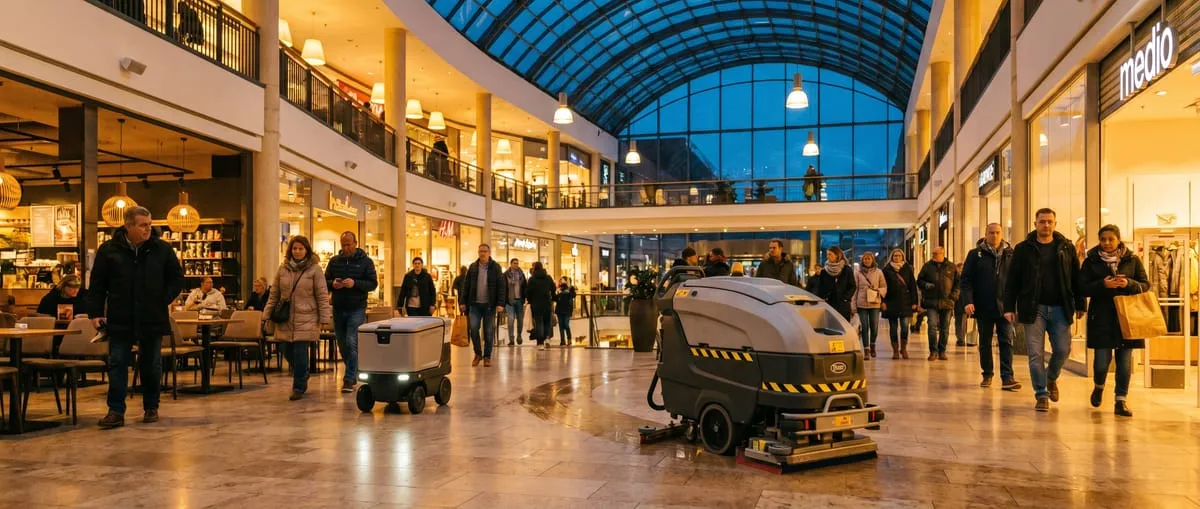
Trays, room service and in-venue delivery.
Hotels, malls, front-of-house — where your clients already are.
03
Commercial floors, scrubbed on schedule.
The fastest-growing — the simplest first deployment.
04
Collaborative arms: pick, tend, assemble.
The industrial line — through the same trusted channel.
05
Dimension, weigh and scan, inside the parcel flow.
A specialist niche, covered end-to-end.
06
After-hours patrol and site inspection.
Where security integrators already hold the client.
One factory per category, exclusively — the map is curated, never crowded.
THE 70% THESIS
30%
Hardware is a third of the outcome. Buy it well and you've solved a third.
70%
Integration, certification, service and proof — the part a lone buyer carries alone. The alliance owns it.

GET THE REPORT
Gated — request it once, and we send the PDF with the GCC data appendix.